I recently had the opportunity to collaborate with Mila Parkour from
Contagio in
her research of the recent
Adobe Flash 0-day (CVE-2011-0611) During this research, I utilized some basic memory forensics in an effort to learn more about the exploit in a running state on a compromised machine. This was also a good opportunity for me to try the latest version of
"volatility - An advanced memory forensics framework". I had been a user of version 1.3 and its associated plug-ins, but with the 1.4 beta version recently released, I thought I'd give it a try.
The setup instructions and documentation for volatility is very good, and the project has wide community support. The best place to start is via the project page at
http://code.google.com/p/volatility/ There are versions for both Windows and Linux, with a full set of instructions at
http://code.google.com/p/volatility/wiki/FullInstallation
For the CVE-2011-0611 analysis, I started with a fully patched XP Professional VirtualBox guest. I ensured that I had the latest Flash and Reader versions from the Adobe site. I also ensured that my Office 2007 installation was fully patched. I started an instance of wireshark on my host computer and tested that it was only seeing packet traffic from the guest. One major difference between VMWare and VirtualBox is in its saving of live memory. If you suspend a virtual guest in VMWare, it will create a suspend file with a .vmem extension that is essentially a memory dump at the time of the suspend. Most memory analysis tools such as volatility will work seamlessly with a .vmem file. VirtualBox handles the suspend, or 'save machine state' a bit differently, in that it will only dump the memory that was actively used at the time of the suspend. In this case, you will need to use another method to dump out the full RAM contents. In my case, I utilized win32dd.exe by
MoonSols . Note that using a program such as win32dd.exe will leave artifacts of the program in memory. Once everything was ready, I launched the infected document and waited until I saw network activity to
liciayee.dyndns-free.com at
123.123.123.123. At this point, I executed win32dd.exe and saved the memory file to my server as "mem.dmp"
volatility 1.4 includes many
default plug-ins and commands that will allow for some very good preliminary analysis of your memory dump. The first thing that you should run is the
"imageinfo" command which will provide basic info about acquired dump. This will also tell you the suggested profile to use for subsequent analysis. The image below shows this command being run against 'mem.dmp'. Note that one of the suggested profiles is 'WinXPSP3x86'. Since I know that my guest VM is SP3, I will use this profile in all my volatility runs against this dump.
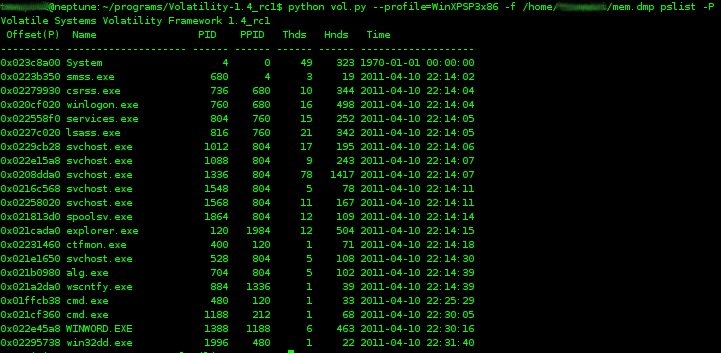
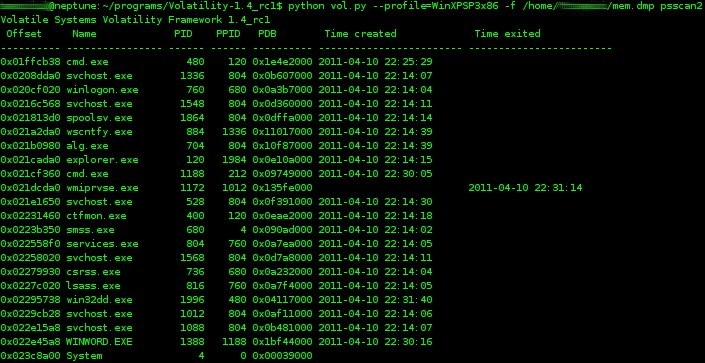
volatility has a number of commands that will detail the running processes. Two such commands are
'pslist' and
'psscan2' . From the volatility wiki,
"To list the processes of a system, use the pslist command. This walks the doubly-linked list pointed to by PsActiveProcessHead. It does not detect hidden or unlinked processes." The psscan2 command will utilize pool tag scanning to enumerate running processes. This may help identify terminated processes or those hidden by a rootkit. For consistency, I ran the pslist command with the "-P" switch, which displays the physical memory offset.
 |
| pslist command |
 |
| psscan2 command |
Next, I wanted to view the active connections and the process ID associated with the TCP connection to
123.123.123.123. The command,
'connections' will list active connections, the PID, and the remote IP address. In this case, you can see that process ID 1336 is associated with the TCP connection to
123.123.123.123.
Since I now know that PID 1336 is associated with the connection to the remote server, I want to now look for any http commands or other strings of interest. The
'malfind' command is a very flexible command that will allow for advanced searching using regex, unicode, or ANSI strings. 'malfind' will also find hidden or injected code in user memory. Since volatility uses the
yara malware identification and classification tool, you can create and specify a yara-rules file for your search patterns, or simply specify the search criteria on the command line. In the figure below, I ran the malfind command against PID 1336 in order to search for the string
"http://" Note in the first block, the interesting strings
"SharkConnect", and
"http://%s%d/upfile.asp.SetProxy".
There is a great deal you can do with
volatility and a RAM dump of this kind. For example, you could discover loaded DLLs, list a process' open files and registry keys, extract a process to a .exe, extract a DLL to a .exe, get detailed information on Windows services, etc. For this example of CVE-2011-0611, I took a memory snapshot almost immediately after the infected Word doc was opened. As I look into this further, I'm going to take a series of RAM snapshots over time and compare the memory artifacts and behavior.
I've placed a link to a password protected copy of the CVE-2011-0611 memory dump (53MB) at the bottom of this post. Please contact me if you want the password for research purposes. I'll remove the password after Adobe releases a patch for CVE-2011-0611.
I hope this simple example of using volatility to examine memory behavior of the recent Adobe 0-day encourages you to utilize this awesome tool in your forensics arsenal.
UPDATE: On 4/15/2011 Adobe has released a
security update for Adobe Flash Player - CVE-2011-0611. The memory dump file as described above is now available without password protection.


